India’s exports show upward trend
India’s overall exports in August 2021 showed positive growth not just against August 2020 but also August 2019
THC Bureau | September 15, 2021 10:53 am
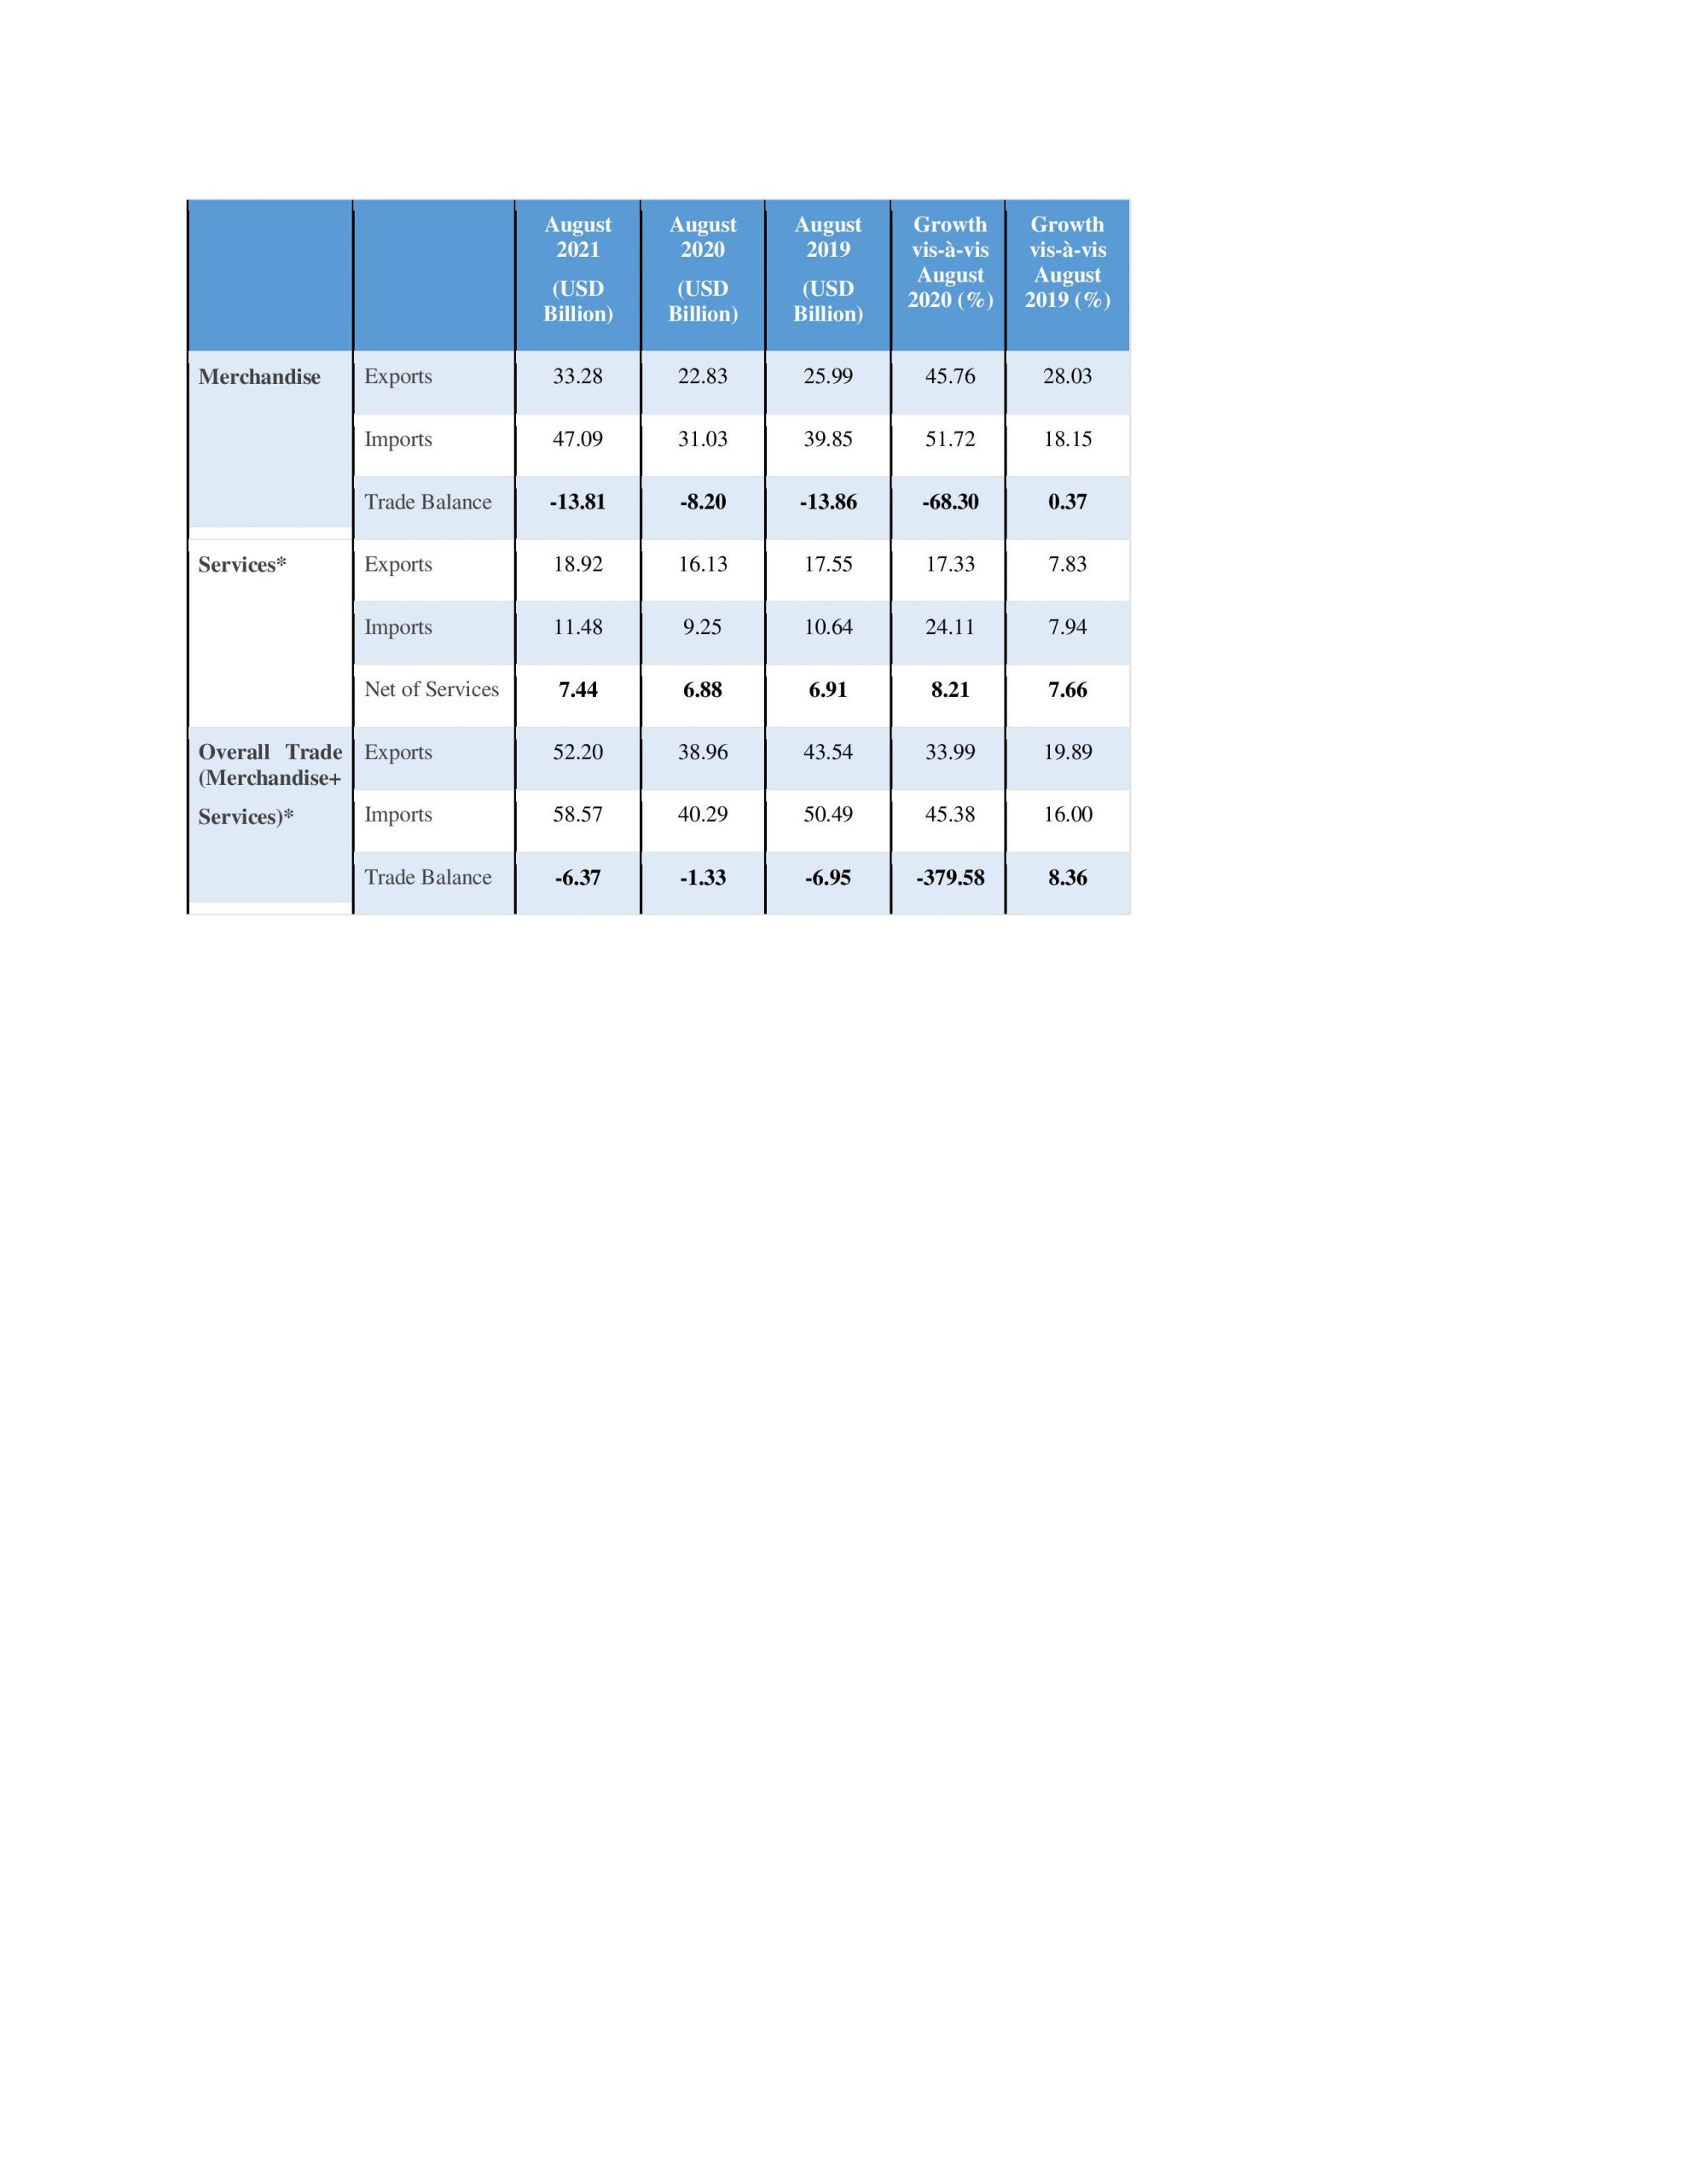
Source: PIB
India’s overall exports (merchandise and services combined) in August 2021 are estimated to be $52.2 billion, exhibiting a positive growth of 33.99 per cent over the same period last year and a positive growth of 19.89 per cent over August 2019, said an official press release. Overall imports in August 2021 are estimated to be $58.57 billion, exhibiting a positive growth of 45.38 per cent over the same period last year and a positive growth of 16 per cent over August 2019
India’s overall exports (merchandise and services combined) in April-August 2021 are estimated to be $256.17 billion, exhibiting a positive growth of 44.04 per cent over the same period last year and a positive growth of 15.79 per cent over April-August 2019. Overall imports in April-August 2021are estimated to be $273.45 billion, exhibiting a positive growth of 64.18 per cent over the same period last year and a positive growth of 3.38 per cent over April-August 2019.
Merchandise exports in August 2021 were $33.28 billion, as compared to $22.83 billion in August 2020, exhibiting a positive growth of 45.76 per cent. In rupee terms, exports were Rs 246,863.37 crore in August 2021, as compared to Rs 170,470.61 crore in August 2020, registering a positive growth of 44.81 per cent. As compared to August 2019, exports in August 2021 exhibited a positive growth of 28.03 per cent in dollar terms and 33.5 per cent in rupee terms.
The commodities/commodity groups which recorded positive growth during August 2021 vis-à-vis August 2020 are petroleum products (144.6 per cent), gems & jewellery (88.3 per cent), engineering goods (59.01 per cent), cotton yarn/fabs./made-ups, handloom products, etc. (55.84 per cent), manmade yarn/fabs./made-ups, etc. (51.71 per cent), marine products (50.7 per cent), coffee (42.31 per cent), mica, coal & other ores, minerals including processed minerals (38.56 per cent), organic & inorganic chemicals (35.94 per cent), Electronic goods (31.67 per cent), jute manufacturing including floor covering (25.3 per cent), handicrafts excluding handmade carpet (24.67 per cent), ceramic products & glassware (18.07 per cent), plastic & linoleum (16.33 per cent), RMG of all textiles (14.15 per cent), cashew (12.58 per cent), cereal preparations & miscellaneous processed items (12.19 per cent), fruits & vegetables (10.13 per cent), tea (8.55 per cent), leather & leather products (8.37 per cent), carpet (6.93 per cent), rice (6.78 per cent), drugs & pharmaceuticals (1.36 per cent), and spices (0.23 per cent).
The commodities/commodity groups which recorded negative growth during August 2021 vis-à-vis August 2020 are iron ore (-64.58 per cent), oil meals (-45.75 per cent), meat, dairy & poultry products (-15.39 per cent), oil seeds (-5.78 per cent), other cereals (-2.56 per cent), and tobacco (-2.55 per cent).
Cumulative value of exports for the period April-August 2021 was $164.1 billion (Rs 1,214,442.5 crore) as against $98.06 billion (Rs 738,849.55 crore) during April-August 2020, registering 67.33 per cent growth in dollar terms (64.37 per cent in rupee terms). As compared to April-August 2019, exports in April-August 2021 exhibited a positive growth of 23.25 per cent in dollar terms and 30.83 per cent in rupee terms.
Non-petroleum and non-gems and jewellery exports in August 2021 were $25.19 billion, as compared to $19.1 billion in August 2020, registering a growth of 31.87 per cent. As compared to August 2019, non-petroleum and non-gems and jewellery exports in August 2021registered a growth of 28.73 per cent. Non-petroleum and non-gems and jewellery exports in April-August 2021 were $124.55 billion, as compared to $83.48 billion for the corresponding period in 2020-21, which is an increase of 49.21 per cent. As compared to April-August 2019, the segment registered a growth of 24.99 per cent.

